Your Zenovay dashboard is your command center for understanding your website's traffic and visitor behavior. This guide walks you through every section and what each metric means.
Dashboard Overview
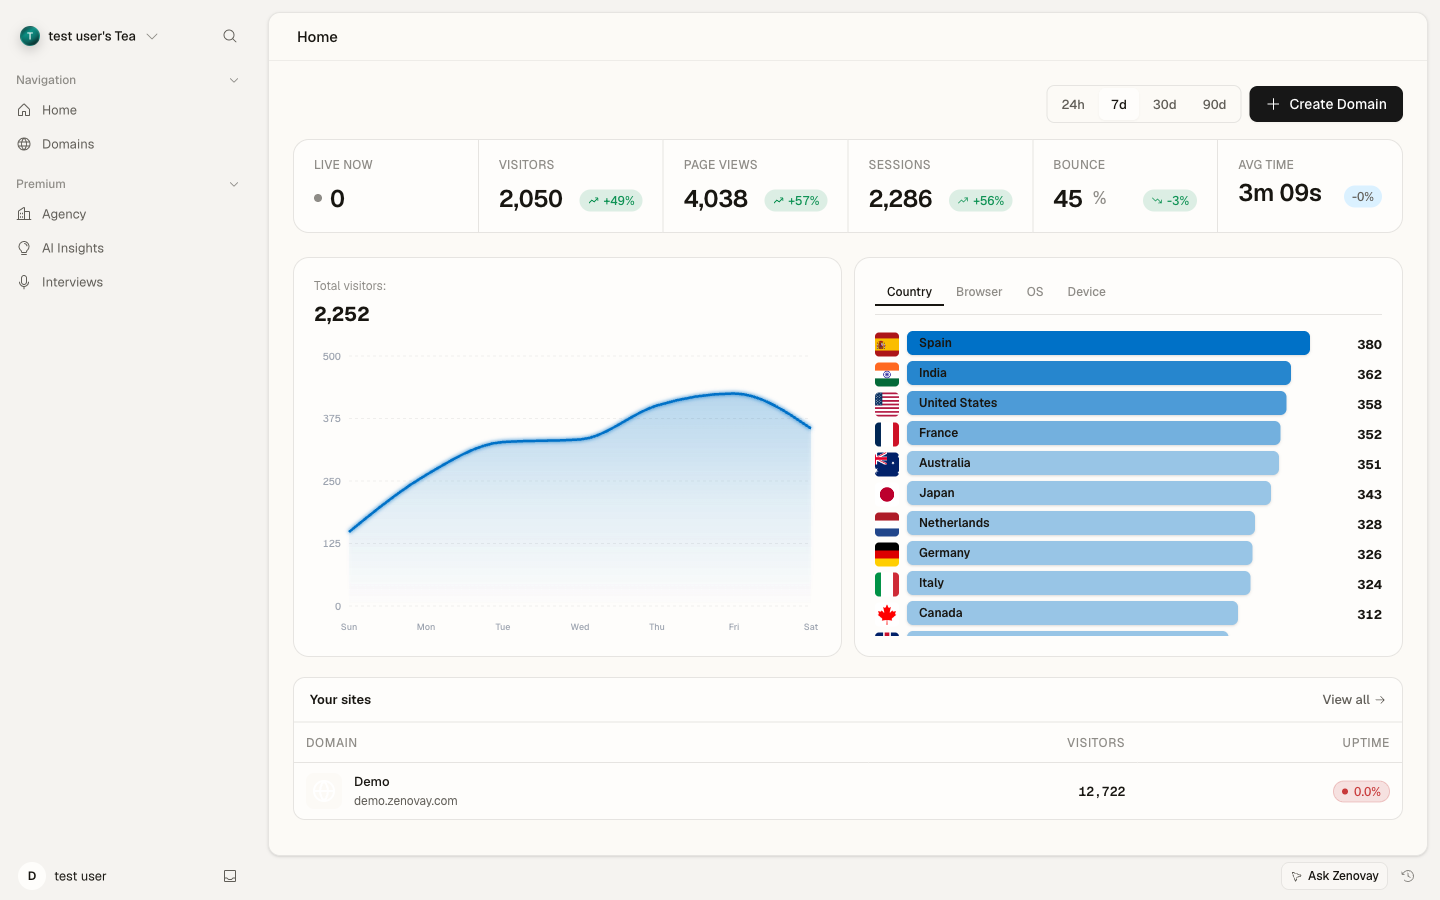
After signing in, you land on your team Home (/home), which summarizes activity across all of your websites. To dig into a single site, open Domains (/domains) and pick a website. That opens its dashboard at /domains/{id}?tab=analytics.
Inside a website's dashboard you'll see:
- Sidebar: Switch between dashboard tabs, grouped by purpose (Behavior, Audience, Revenue, Reliability, Configure & Explore)
- Date Range Selector: Filter data by time period
- Main Content Area: Displays the selected tab's data
You can also switch websites and reach account and workspace settings from the sidebar.
Dashboard Tabs
Each website's dashboard is organized into five sidebar groups. The most-used tabs are listed below.
Behavior
- Analytics — your main overview (see metrics below)
- Globe — interactive 3D visualization of visitor locations
- Performance — Core Web Vitals and page-load timings
- Uptime — uptime percentage, response times, and incident history
- Retention — how often visitors come back over time
- Insights Pro Plan — AI-generated trends, anomalies, and recommendations
- Daily Movers Pro Plan — what changed day over day and why
- Companies Scale Plan — B2B company identification
- AI Influence — how AI assistants and crawlers reference your site
Audience
- Live View — a real-time list of visitors currently on your site
- Sessions Pro Plan — session replay recordings
- Heatmaps Pro Plan — click, scroll, and movement heatmaps
- Journeys — common navigation paths, entry and exit pages, and drop-off points
- Demographics — language, locale, timezone, and inferred-region distribution
- Downloads — file-download activity
Revenue
- Revenue Pro Plan — revenue attribution by traffic source, average order value, conversion rates
- Incidents — conversion incidents detected on the site
- Golden Path Pro Plan — monitors that watch a critical conversion flow end to end
- Experiments Pro Plan — A/B test results
Reliability
- Errors Pro Plan — JavaScript error groups, stack traces, and affected browsers
- Trust — server-vs-client reconciliation of your numbers
- Carbon — estimated carbon footprint of your pages
- Consent Pro Plan — how your own cookie-consent banner is performing
Configure & Explore
- Widgets Pro Plan — embeddable on-site widgets
- Query Studio Scale Plan — run SQL against your analytics data
Live View updates automatically. The "Watch cursor" overlay inside each visitor card is a Pro feature.
Globe
FreeThe Globe tab is an interactive 3D visualization showing:
- Visitor locations as markers on the globe
- Real-time visitor activity with animated markers
- Color-coded markers based on visitor value score
- Country drill-down on click
You can publish a read-only version of the globe with a public share link from the Globe tab → Share.
Sessions
Pro PlanSession replay lets you:
- Watch recordings of visitor sessions
- See mouse movements and clicks
- Understand user behavior patterns
- Filter by duration, pages, or user properties
Heatmaps
Pro PlanVisual representations of user behavior:
- Click heatmaps showing where users click
- Scroll depth showing how far users scroll
- Movement tracking showing mouse patterns
Errors
Pro PlanJavaScript error tracking:
- Error groups and counts
- Stack traces for debugging
- Affected browsers and devices
- Error trends over time
Performance
Core Web Vitals and page performance:
- Largest Contentful Paint (LCP)
- Cumulative Layout Shift (CLS)
- Interaction timings
- Page load times by device
Revenue
Pro PlanRevenue attribution and tracking:
- Total revenue tracked
- Revenue by traffic source
- Average order value
- Conversion rates
Insights
Pro PlanAI-powered analytics insights:
- Automated anomaly detection
- Traffic trend analysis
- Performance recommendations
Journeys
User flow analysis:
- Common navigation paths
- Drop-off points
- Entry and exit pages
Companies
Scale PlanB2B visitor identification:
- Company names visiting your site
- Industry and company size
- Visit history by company
- Account-based marketing data
Uptime
Website monitoring:
- Uptime percentage
- Response times
- Incident history
- Alert configuration
Key Metrics Explained
Visitors vs Page Views
- Visitors (Unique): Individual people who visited your site. Each person is counted once per period.
- Page Views: Total pages loaded. One visitor viewing 5 pages = 5 page views.
Bounce Rate
The percentage of sessions where visitors:
- Viewed only one page
- Left without any interaction
- Had session duration under 30 seconds
What's a Good Bounce Rate?
Typical bounce rates vary by industry: 40-60% for most websites, 70-90% for blogs, 20-40% for e-commerce. Context matters more than the number.
Session Duration
Average time visitors spend on your site. Calculated from first to last tracked event in a session.
Visitor Value Score
A 1-100 score predicting visitor quality based on:
- Time on site
- Pages viewed
- Engagement signals
- Traffic source quality
Using Date Ranges
Click the date selector to:
- Choose preset ranges (Today, Yesterday, Last 7 Days, etc.)
- Set custom date ranges
- Compare against the previous period
Open the Date Range Selector
Click the date display near the top of your dashboard.
Select Range
Choose a preset like "Last 30 Days" or set custom dates.
Apply Filter
All dashboard data updates to show the selected period.
Filtering Data
Most tabs support filtering by:
- Traffic Source: Organic, paid, social, direct, referral
- Country: Geographic location
- Device: Desktop, mobile, tablet
- Browser: Chrome, Safari, Firefox, etc.
- Operating System: Windows, macOS, iOS, Android
Exporting Data
Pro PlanExport your analytics data:
- Navigate to the desired tab
- Set your date range
- Use the Export option
- Choose your format
- Download your data
Next Steps
Now that you understand your dashboard:
- Learn about specific metrics in depth
- Set up conversion goals
- Invite team members to collaborate
- Explore the 3D Globe visualization