The Zenovay dashboard is your analytics command center. This guide walks through how a website's dashboard is laid out and how to navigate it effectively.
Dashboard Layout
Each tracked website has its own dashboard at app.zenovay.com/domains/{id}. Open it from the Domains list in the left sidebar (or from your team Home). Once you're inside a website, the screen is organized into these areas:
Left Sidebar
The sidebar lists your websites and, for the website you're viewing, the analytics tabs grouped into sections (Behavior, Audience, Revenue, Reliability, and Configure & Explore). Click a tab to switch views. Each tab maps to a URL like app.zenovay.com/domains/{id}?tab=analytics.
Top Bar
Above the content area you'll find:
- Date Range Picker: Choose the time period for the data on screen
- Filters: Narrow data by source, country, device, page, and more
- Refresh: Re-fetch the current view
Main Content Area
Displays data for the selected tab with:
- Summary cards with key metrics
- Interactive charts and graphs
- Detailed data tables
- Filters and controls
Press Cmd/Ctrl + K anywhere in the app to open the command palette and jump to any website, tab, or setting.
Analytics Tab (Main View)
The Analytics tab (under Behavior) is your primary overview showing:
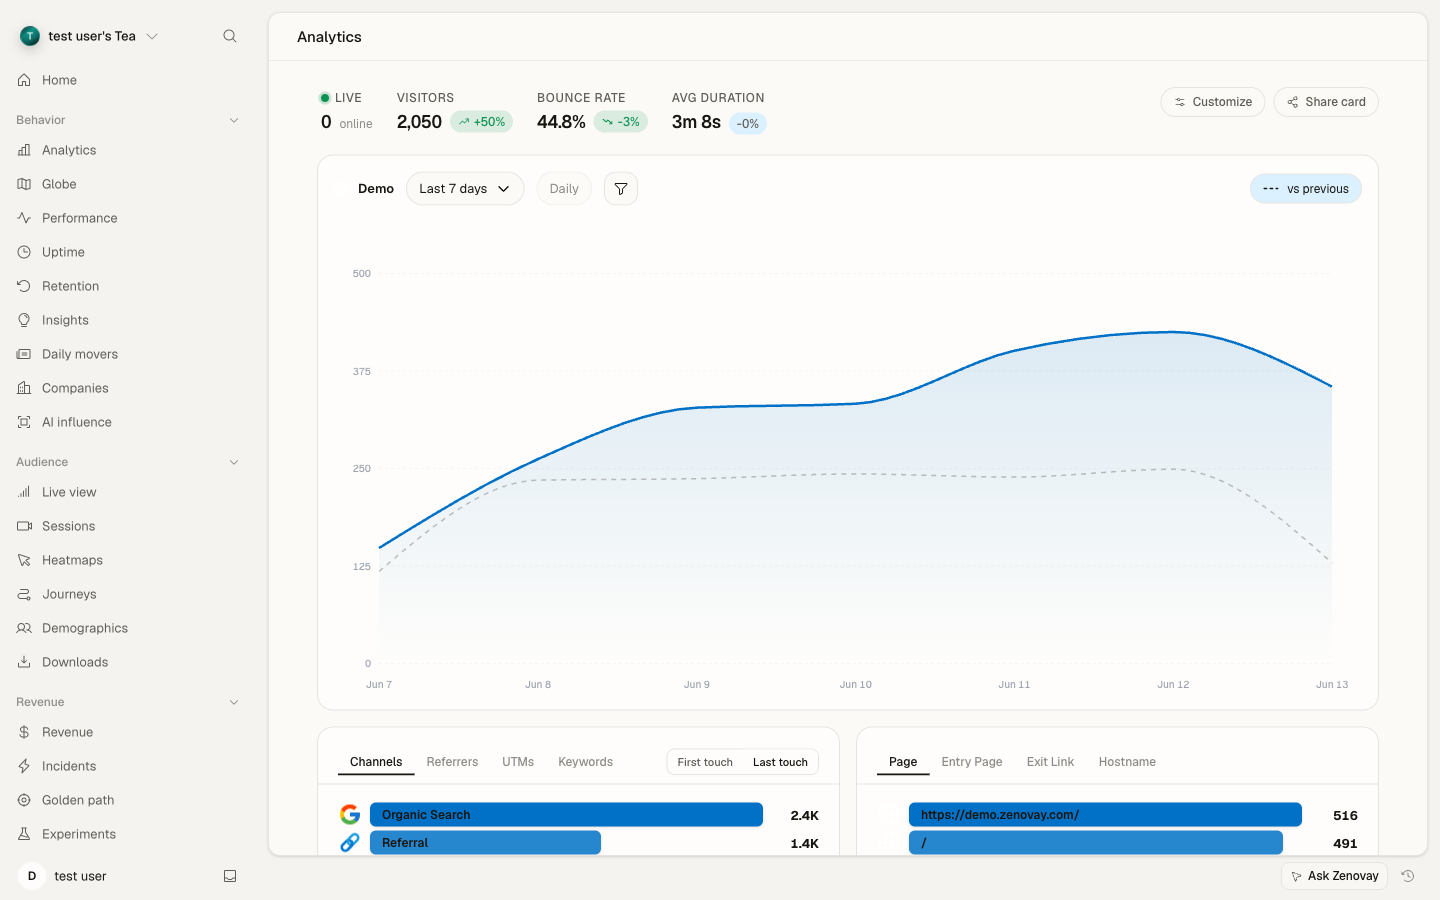
Key Metrics Cards
| Metric | Description |
|---|---|
| Visitors | Unique visitors in selected period |
| Page Views | Total pages viewed |
| Bounce Rate | Single-page sessions percentage |
| Avg. Duration | Average time on site |
Visitor Chart
- Time-series graph of visitors
- Toggle between visitors and page views
- Hover for detailed values
- Click to drill into specific days
Traffic Sources
Breakdown by source type:
- Direct: Typed URL or bookmark
- Organic: Search engine traffic
- Referral: Links from other sites
- Social: Social media platforms
- Paid: Advertising campaigns
Geographic Distribution
- Country/region breakdown
- Top countries list
Top Pages
- Most visited pages
- Page view counts
- Unique visitors per page
Device & Browser
- Desktop vs Mobile vs Tablet
- Browser distribution
- Operating system breakdown
Live View Tab
The Live View tab (under Audience) shows real-time visitor activity:
Current Visitors Count
A live count of currently active visitors, refreshed automatically.
Active Visitors List
For each visitor:
- Current page being viewed
- Geographic location
- Referrer source
- Time on site
Live View is great for monitoring campaigns, product launches, or high-traffic events in real time.
Globe Tab
The Globe tab (under Behavior) is an interactive 3D visualization of where your visitors are:
Globe Features
- Spin and zoom controls
- Visitor markers by location
- Real-time activity animation
- Country click-through
Interactions
- Click countries to filter
- Hover for visitor details
- Drag to rotate
- Scroll to zoom
You can publish a read-only version of the globe at app.zenovay.com/share/globe/{token}. Open the Globe tab and use the Share option to generate the link.
Sessions Tab
Pro PlanSession replay (under Audience) lets you watch recorded visitor sessions:
Session List
Browse recorded sessions with:
- Duration
- Pages visited
- User actions
- Country/device info
Session Player
Watch sessions with:
- Play/pause/skip controls
- Speed adjustment
- Event timeline
Heatmaps Tab
Pro PlanVisual behavior analysis (under Audience):
Heatmap Types
- Click Heatmap: Where users click
- Scroll Heatmap: How far users scroll
- Movement Heatmap: Mouse movement patterns
Controls
- Page URL selector
- Device type filter
- Date range filter
Errors Tab
Pro PlanJavaScript error tracking (under Reliability):
Error List
- Error message
- Occurrence count
- Affected browsers
- First/last seen dates
Error Details
- Full stack trace
- Affected URL
- Source code context
Performance Tab
Pro PlanCore Web Vitals monitoring (under Behavior):
Key Metrics
| Metric | What It Measures | Good Score |
|---|---|---|
| LCP | Loading performance | < 2.5s |
| INP | Interactivity | < 200ms |
| CLS | Visual stability | < 0.1 |
Performance by Page
- Page-level breakdowns
- Device comparisons
- Trend over time
Revenue Tab
Pro PlanRevenue attribution (under Revenue):
Revenue Metrics
- Total revenue
- Average order value
- Conversion rate
- Revenue by source
Attribution
- First-touch attribution
- Last-touch attribution
Insights Tab
Pro PlanAI-powered analytics (under Behavior):
Automated Insights
- Traffic anomalies
- Trend detection
- Performance signals
- Recommendations
Ask Zenovay
Ask questions in plain language, such as:
- "What's my top traffic source?"
- "Show me weekend vs weekday traffic"
- "Which pages have high bounce rates?"
Journeys Tab
Pro PlanUser flow analysis (under Audience):
Path Analysis
- Common navigation paths
- Entry points
- Exit points
- Drop-off analysis
Funnel Visualization
- Step-by-step conversion
- Drop-off percentages
Companies Tab
Scale PlanB2B visitor identification (under Behavior):
Company List
- Company names
- Industry
- Employee count
- Visit frequency
Company Details
- All visits from company
- Pages viewed
- Engagement score
Uptime Tab
Website monitoring (under Behavior). Basic uptime is available on every plan; enhanced monitoring (SSL expiry alerts, incidents, keyword checks) is included on Pro and above.
Status Overview
- Current status
- Uptime percentage
- Response time
- Incident history
Alerts
- Configure thresholds
- Email notifications
Navigation Tips
- Cmd/Ctrl + K opens the command palette to jump to any website, tab, or setting
- Click metrics and chart points to drill into the underlying data
- Use the filters and date range picker in the top bar to narrow what you're looking at