Master stack trace analysis to quickly identify and fix JavaScript errors in your application.
Understanding Stack Traces
Anatomy of a Stack Trace
TypeError: Cannot read property 'email' of undefined
    at getUserEmail (user-service.js:45:12)    ← Error location
    at validateForm (form-handler.js:123:8)    ← Called from here
    at HTMLFormElement.<anonymous> (form.js:67:5) ← Event handler
    at HTMLFormElement.dispatch (jquery.min.js:3:10456)
    at HTMLFormElement.v.handle (jquery.min.js:3:8765)
Stack Frame Components
Each line contains:
| Component | Example | Description |
|---|---|---|
| Function | getUserEmail | Function name |
| File | user-service.js | Source file |
| Line | 45 | Line number |
| Column | 12 | Column position |
Reading Direction
Read stack traces top to bottom:
- Top frame: Where error occurred
- Middle frames: Call chain
- Bottom frames: Entry point
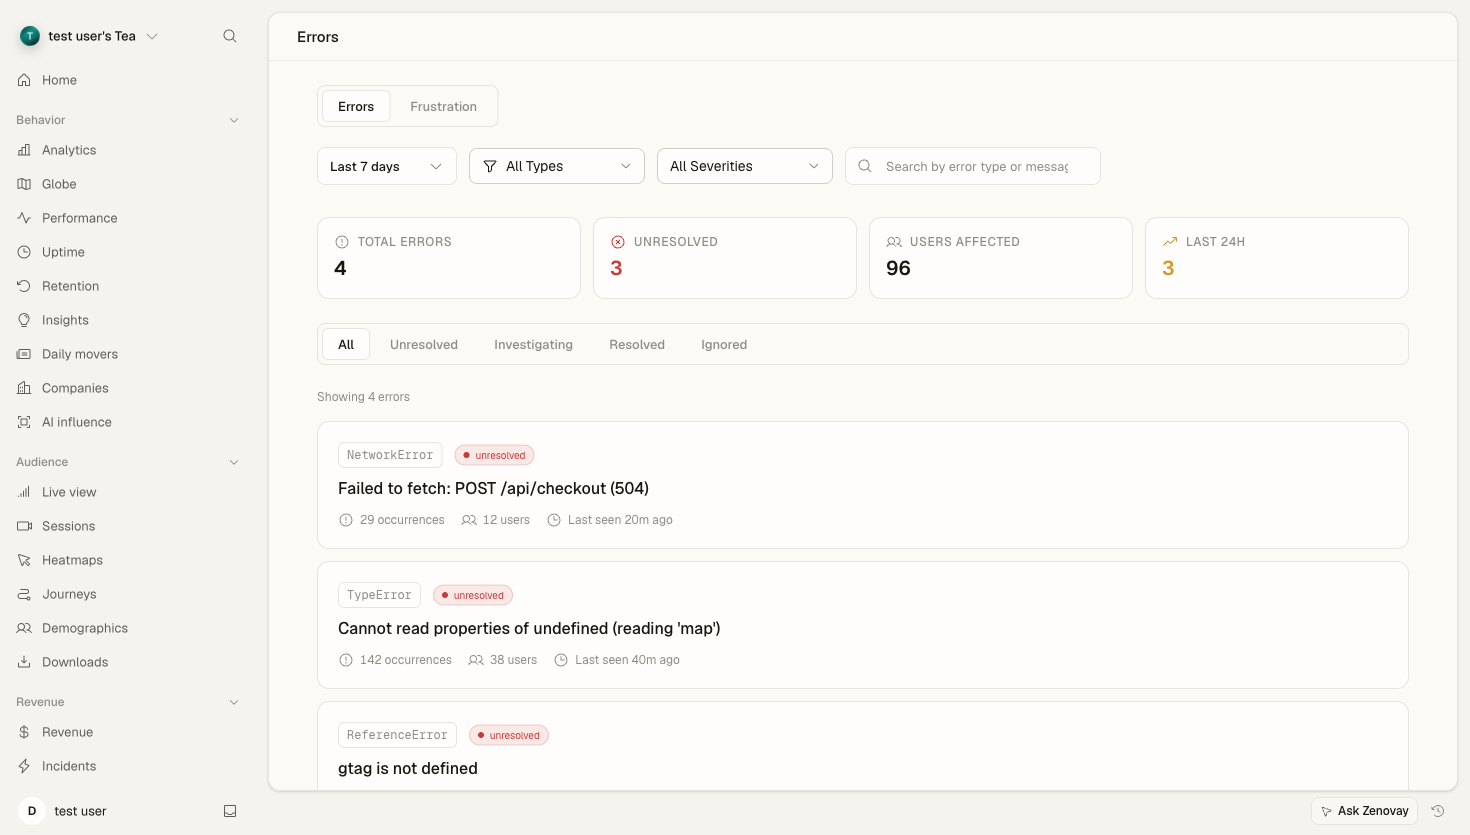
Viewing Stack Traces in Zenovay
Error tracking is a Pro feature. Once it's enabled for a website, captured errors are grouped by fingerprint and shown on the Errors tab of that website's dashboard (/domains/{your-site}?tab=errors).
To enable it, open the website's settings, go to the Advanced section, and turn on Error Tracking under feature flags.
The Error Detail View
Open an error group from the Errors tab to see its recent occurrences. For each occurrence you can review:
- The error type and message
- The page URL where it happened
- Browser, OS, and device breakdowns
- The breadcrumbs ("user actions before" the error) leading up to it
- The stack trace, shown as an expandable list of frames
The stack trace is collapsed by default. Expand it to see each frame as:
at getUserById (user-service.js:45:12)
at handleGetUser (api-handler.js:78:5)
at <anonymous> (router.js:23:3)
Long traces are truncated to the first frames, with a "more frames" indicator for the rest. The function name, file, line, and column are shown for each frame so you can jump straight to the relevant code in your editor.
Source Maps
Source maps let Zenovay turn minified production stack traces back into your original source file, line, and column.
Without Source Maps
Minified code produces cryptic traces:
TypeError: a is not a function
    at e (main.abc123.js:1:34567)
    at t.handleClick (main.abc123.js:1:45678)
    at Object.onClick (main.abc123.js:1:56789)
With Source Maps
Same error, readable:
TypeError: processPayment is not a function
    at handleCheckout (checkout.tsx:89:12)
    at CheckoutButton.handleClick (CheckoutButton.tsx:45:8)
    at onClick (form-events.ts:23:5)
Generating Source Maps
The first step is to generate source maps during your build. Use hidden source maps in production so the .map files are created but never referenced (or served) from your public bundle.
Webpack - generate hidden source maps:
// webpack.config.js
module.exports = {
  devtool: 'hidden-source-map',
  // Source maps generated but not referenced in output
};
Vite - generate hidden source maps:
// vite.config.js
export default {
  build: {
    sourcemap: 'hidden'
  }
};
Rollup - generate hidden source maps:
// rollup.config.js
export default {
  output: {
    sourcemap: 'hidden'
  }
};
Tag each build with a release version (see Release Correlation below) so source maps and errors line up against the same deploy.
Analyzing Common Patterns
Undefined Property Access
TypeError: Cannot read property 'name' of undefined
    at renderUser (user-card.js:23:15)
Analysis:
- Object expected at line 23 is undefined
- Check data flow to
renderUser - Likely missing null check
Fix pattern:
// Before
const name = user.name;

// After
const name = user?.name ?? 'Unknown';
Function Not Defined
ReferenceError: processPayment is not defined
    at handleSubmit (checkout.js:45:5)
Analysis:
- Function called but not in scope
- Check imports/exports
- Verify module loading order
Type Errors
TypeError: users.map is not a function
    at renderUserList (list.js:12:20)
Analysis:
usersis not an array- Check API response format
- Verify data type assumptions
Advanced Analysis
Async Stack Traces
Modern JavaScript includes async context:
Error: API request failed
    at fetchUser (api.js:34:11)
    at async loadUserData (user-loader.js:56:18)
    at async initApp (app.js:12:5)
Cross-Origin Frames
Third-party scripts show limited info:
Error: Script error.
    at <anonymous> (https://third-party.com/widget.js:1:1)
Solution: Add CORS headers to third-party scripts:
<script src="https://third-party.com/widget.js" crossorigin="anonymous"></script>
Minified Third-Party Code
For libraries without source maps:
- Identify library from URL pattern
- Check library version
- Search for known issues
- Consider alternatives
Debugging Workflow
Step 1: Identify Error Location
- Look at top stack frame
- Note file, line, column
- Understand what code is doing
Step 2: Trace the Call Path
- Follow frames down the stack
- Identify data flow
- Find where bad data originates
Step 3: Check Context
- View the error frequency over time on the Errors tab
- Check affected browsers/devices in the breakdown
- Read the breadcrumbs leading up to the error
Step 4: Reproduce
- Use session replay (if available on your plan)
- Check user actions before the error
- Test with same browser/conditions
Step 5: Fix and Verify
- Implement fix
- Deploy new version
- Mark the error group as resolved from the error detail view
- Monitor for regressions
Managing Error Status
From the error detail view you can change a group's status to keep your list focused:
- Unresolved — needs attention (the default)
- Investigating — someone is working on it
- Resolved — fixed and verified
- Ignored — known and intentionally not actioned
Status changes require editor access on the workspace and are recorded in the workspace audit log.
Release Correlation
When you tag your tracking with a release, every captured error records the release it came from, so you can tell which deploy introduced a problem.
Tag Releases
Set a release value in your build so the tracker reports it with each event. The base snippet looks like this:
<script
  defer
  data-tracking-code="YOUR_TRACKING_CODE"
  src="https://api.zenovay.com/z.js"
></script>
Pair this with the matching source maps from your build (tagged with the same release) so production traces symbolicate against the correct version.
Best Practices
Source Map Management
- Use hidden source maps in production
- Keep source maps organized by release
- Tag each build with the release version that matches your deploy
Stack Trace Quality
- Use meaningful function names
- Avoid anonymous functions
- Keep call stacks reasonable depth
- Add error context where needed
Debugging Efficiency
- Start with most impacted errors
- Use status (investigating, resolved, ignored) to focus the list
- Document findings
- Share with your team
Troubleshooting
Missing Source Maps
Check:
- Source maps were generated for this release
- The release version matches what the tracker reports
- File names line up with your deployed bundles
Incomplete Stack Traces
Causes:
- Async code not properly traced
- Errors from eval() or dynamic code
- Browser limitations
"Script error" Messages
Solutions:
- Add CORS headers
- Use the crossorigin attribute
- Self-host third-party scripts