Monitor Google's Core Web Vitals to improve user experience and search rankings.
What Are Core Web Vitals?
Core Web Vitals are Google's metrics for measuring user experience:
| Metric | Full Name | Measures | Good | Needs Work | Poor |
|---|---|---|---|---|---|
| LCP | Largest Contentful Paint | Loading | ≤2.5s | 2.5-4s | >4s |
| INP | Interaction to Next Paint | Interactivity | ≤200ms | 200-500ms | >500ms |
| CLS | Cumulative Layout Shift | Visual Stability | ≤0.1 | 0.1-0.25 | >0.25 |
Why They Matter
- SEO Impact: Google uses CWV as ranking signals
- User Experience: Correlate with engagement and conversion
- Performance Budget: Set measurable targets
Enabling CWV Monitoring
Core Web Vitals monitoring is enabled by default on every plan, including Free. As long as your tracking script is loading, the tracker collects LCP, CLS, INP, FCP, and TTFB from every real visitor session and ships one beacon per page when the visitor leaves.
Your standard script tag is all you need:
<script
  defer
  data-tracking-code="YOUR_TRACKING_CODE"
  src="https://api.zenovay.com/z.js"
></script>
No additional attributes, no script changes. If you want to confirm the tracker is firing at all, open the Install Health tab in your website's settings.
Disabling for a specific site (advanced)
If you ever need to opt a single tracked site out of CWV collection, the enable_core_web_vitals feature flag for that site needs to be set to false. There is no in-app toggle today because the default is on for everyone — contact support at support@zenovay.com if you'd like that changed for one of your sites.
Dashboard Overview
CWV Summary
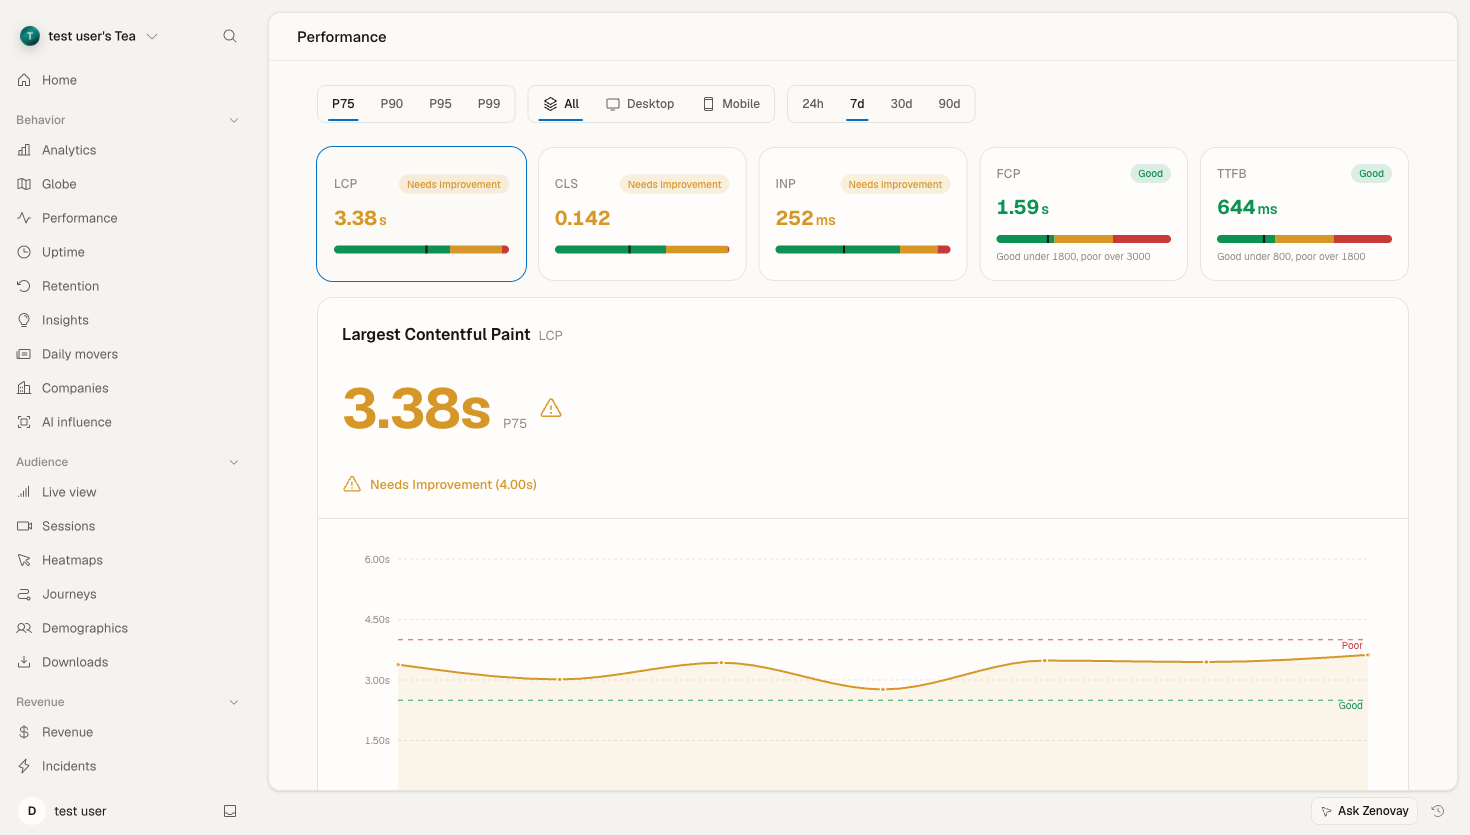
Open your website's dashboard and select the Performance tab (under the BEHAVIOR group in the sidebar):
Core Web Vitals Overview

LCP    ████████████████░░░░ 2.1s  ✓ Good
INP    ██████████████████░░ 156ms ✓ Good
CLS    ████████████████████ 0.05  ✓ Good

P75 scores
The toolbar lets you switch the percentile (P75, P90, P95, P99), filter by device (All, Desktop, Mobile), and change the time range (24 hours, 7 days, 30 days, or 90 days).
Score Distribution
Each metric tile shows how your visits split across the Good / Needs Improvement / Poor thresholds for the selected percentile:
| Rating | LCP | INP | CLS |
|---|---|---|---|
| Good | 65% | 72% | 85% |
| Needs Improvement | 25% | 20% | 10% |
| Poor | 10% | 8% | 5% |
Largest Contentful Paint (LCP)
What It Measures
Time until the largest content element is visible:
- Images
- Video thumbnails
- Background images
- Text blocks
LCP in the Dashboard
- Trend over time: LCP at the selected percentile across the chosen range
- By page: Slowest routes
- By device: Desktop vs Mobile
- By geography: A choropleth of LCP by country/region
- Offending elements: The specific elements measured as the LCP
Common LCP Issues
| Issue | Impact | Solution |
|---|---|---|
| Slow server response | High | Optimize TTFB, use CDN |
| Render-blocking resources | High | Defer non-critical CSS/JS |
| Large images | High | Optimize, use WebP, lazy load |
| Client-side rendering | Medium | SSR, pre-rendering |
| Third-party scripts | Medium | Async load, remove unnecessary |
Improving LCP
Image Optimization:
<!-- Preload LCP image -->
<link rel="preload" as="image" href="hero.webp">

<!-- Responsive images -->
<img
  src="hero.webp"
  srcset="hero-400.webp 400w, hero-800.webp 800w, hero-1200.webp 1200w"
  sizes="100vw"
  loading="eager"
  fetchpriority="high"
/>
Resource Hints:
<!-- Preconnect to critical origins -->
<link rel="preconnect" href="https://cdn.example.com">
<link rel="dns-prefetch" href="https://api.example.com">
Interaction to Next Paint (INP)
What It Measures
Responsiveness to user interactions:
- Clicks
- Taps
- Key presses
INP measures the time from interaction to next visual update.
INP in the Dashboard
- INP score: At the selected percentile (default P75)
- By page: Slowest routes for interactivity
- By device: Desktop vs Mobile
Common INP Issues
| Issue | Impact | Solution |
|---|---|---|
| Long JavaScript tasks | High | Break up tasks, use web workers |
| Large DOM | Medium | Virtualize lists, simplify structure |
| Heavy event handlers | High | Debounce, optimize handlers |
| Layout thrashing | Medium | Batch DOM reads/writes |
| Third-party scripts | Medium | Lazy load, isolate |
Improving INP
Break Up Long Tasks:
// Before: Long synchronous task
function processLargeArray(items) {
  items.forEach(item => expensiveOperation(item));
}

// After: Yield to main thread
async function processLargeArray(items) {
  for (const item of items) {
    expensiveOperation(item);
    // Yield to allow rendering
    await new Promise(r => setTimeout(r, 0));
  }
}
Use requestIdleCallback:
function runWhenIdle(callback) {
  if ('requestIdleCallback' in window) {
    requestIdleCallback(callback, { timeout: 2000 });
  } else {
    setTimeout(callback, 100);
  }
}
Cumulative Layout Shift (CLS)
What It Measures
Visual stability - how much content shifts unexpectedly:
- Images loading without dimensions
- Ads/embeds resizing
- Dynamic content insertion
- Web fonts loading
CLS in the Dashboard
- CLS score: At the selected percentile (default P75)
- By page: Pages with the most shift
- By device: Desktop vs Mobile
Common CLS Issues
| Issue | Impact | Solution |
|---|---|---|
| Images without dimensions | High | Always set width/height |
| Ads without reserved space | High | Use placeholder containers |
| Dynamic content above fold | Medium | Reserve space, use transforms |
| Web font loading | Medium | Use font-display: swap |
| Late-loading embeds | Medium | Reserve space, lazy load |
Improving CLS
Reserve Space for Images:
<!-- Always include dimensions -->
<img src="photo.jpg" width="800" height="600" alt="Photo">

<!-- Or use aspect ratio -->
<style>
.image-container {
  aspect-ratio: 16 / 9;
}
</style>
Reserve Space for Ads:
.ad-slot {
  min-height: 250px;
  background: #f0f0f0;
}
Font Loading Strategy:
@font-face {
  font-family: 'CustomFont';
  src: url('font.woff2') format('woff2');
  font-display: swap;
}
Page-Level Analysis
Drill Down by Page
The Performance tab includes a per-route breakdown so you can see which pages drag a metric down:
- Open the Performance tab
- Scroll to the by-page breakdown
- Sort to find the worst performers
- Use the offending-elements panel to see what's being measured as the LCP
Page Performance Card
/products/widget

LCP:  2.8s   ⚠ Needs Improvement
INP:  145ms  ✓ Good
CLS:  0.18   ⚠ Needs Improvement

Offending elements:
• LCP element:   img.hero-banner
• CLS source:    .reviews-widget
• INP target:    button.add-to-cart

Samples: 12,450
The offending-elements panel surfaces the specific page element measured as the LCP, the largest source of layout shift, and the element a user interacted with for the slowest INP. Those CSS selectors point you straight at what to fix.
Segmentation
By Device Type
Filter the whole Performance tab by device (All, Desktop, or Mobile):
Device      LCP      INP     CLS
Desktop     2.0s     120ms   0.05
Mobile      3.2s     210ms   0.12
By Geography
The geography choropleth shows CWV scores by country/region to help identify CDN or server-location issues:
Region          LCP      INP     CLS
North America   2.1s     140ms   0.05
Europe          2.4s     150ms   0.06
Asia            3.6s     180ms   0.08
Alerts & Reports
Zenovay's automated alerts cover anomaly detection and traffic spikes rather than per-metric web-vital thresholds. To get notified when overall performance shifts, and to schedule recurring summaries, see the dedicated Performance Alerts guide.
Integration with Other Tools
Google Search Console
Compare Zenovay data with GSC:
- Zenovay: Real user data (RUM)
- GSC: Lab data + field data
Lighthouse
Correlate Lighthouse audits with real-world data.
PageSpeed Insights
Use Zenovay for monitoring, PageSpeed for recommendations.
Historical Comparison
Trend Analysis
- Compare across the 24h, 7d, 30d, and 90d ranges
- See improvement over time
- Correlate trends with your own deployment dates
- Track toward goals
Best Practices
Monitoring Strategy
- Set baselines: Know current performance
- Define targets: Based on industry/competitors
- Monitor continuously: Not just one-time audits
- Segment analysis: Mobile often worse
- Prioritize fixes: Impact vs effort
Performance Budget
Metric     Current   Target   Budget
LCP        2.8s      2.0s     ✗ Over
INP        150ms     150ms    ✓ On target
CLS        0.08      0.1      ✓ Under
Regular Reviews
- Weekly: Check for regressions
- Monthly: Deep dive analysis
- Quarterly: Strategic planning
Troubleshooting
Data Not Appearing
Check:
- Script installed correctly (use the Install Health tab in your website's settings to confirm the tracker is firing)
- Core Web Vitals collection hasn't been disabled for the site (it's on by default — see "Disabling for a specific site" above)
- Sufficient traffic (need real users)
Unexpected Values
Consider:
- Bot traffic skewing data
- Development/staging traffic
- Browser support differences
Discrepancy with Lab Data
Normal - RUM captures:
- Real network conditions
- Actual device performance
- Real user behavior
- Geographic distribution