Mobile and desktop visitors rarely get the same experience. A page that loads quickly on a fast laptop can feel sluggish on a phone with a slower processor and a cellular connection. Zenovay's Performance tab (Speed Insights) lets you split your Core Web Vitals by device so you can see — and fix — those gaps.
Where to find it
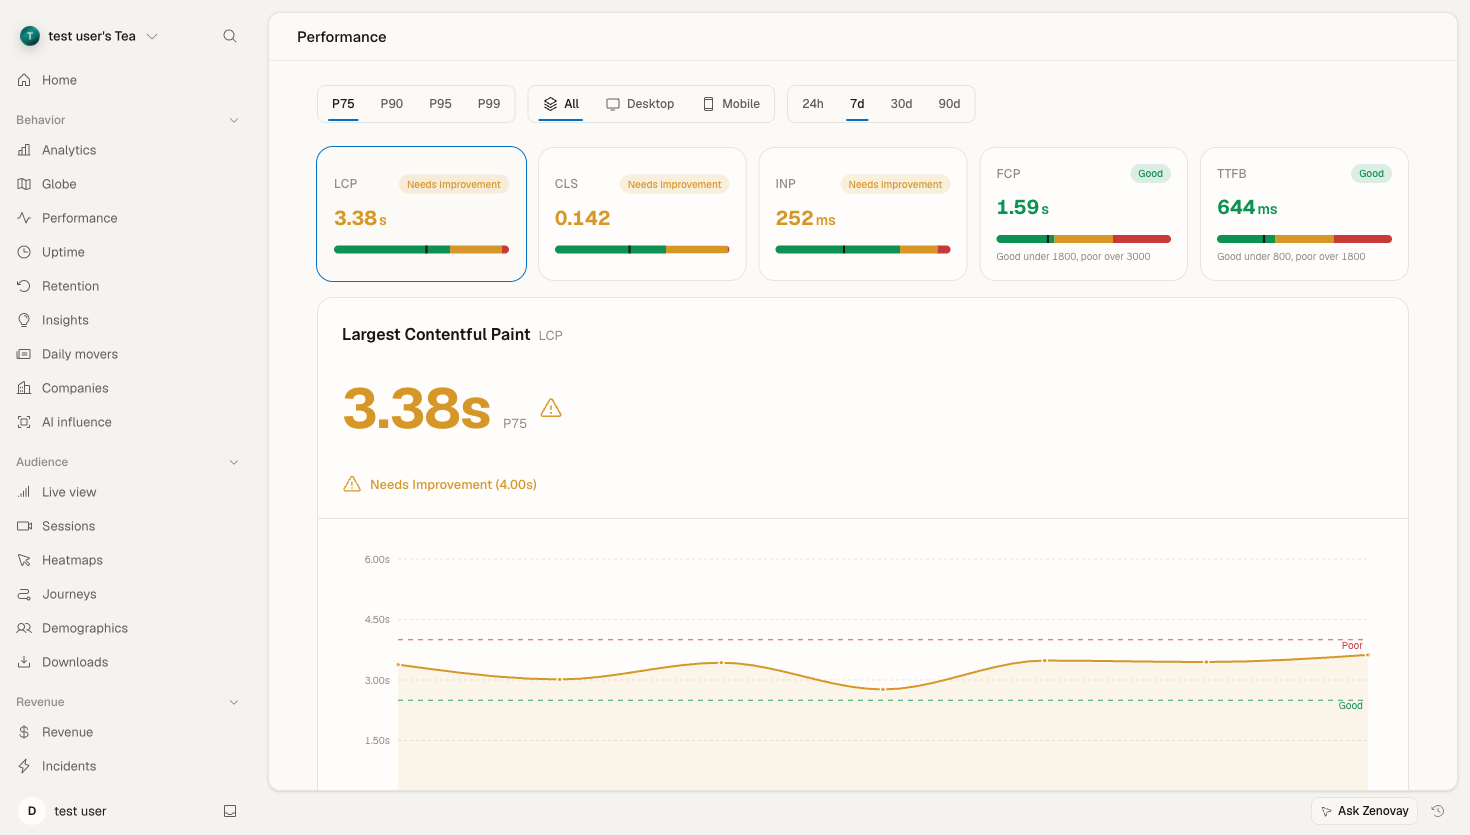
Open your website's dashboard from Domains, then select the Performance tab. Performance is grouped under Behavior in the dashboard sidebar.
The Performance tab measures the five Core Web Vitals from real visitors:
- LCP — Largest Contentful Paint
- CLS — Cumulative Layout Shift
- INP — Interaction to Next Paint
- FCP — First Contentful Paint
- TTFB — Time to First Byte
Info
Performance data is available on every plan. The amount of history you can look back over depends on your plan: Free sees the most recent 24 hours, Pro up to 30 days, and Scale up to 90 days. Longer ranges and the deeper breakdowns below are most useful on Pro and above.
Splitting performance by device
The Performance toolbar has a device filter with three options:
- All — every visitor
- Desktop
- Mobile
Switch the filter to compare the same metric across device classes. Mobile typically shows slower Core Web Vitals than desktop because of:
- Slower processors and less memory
- Cellular networks with higher latency
- Smaller viewports, which can change how content loads and shifts
Pair the device filter with the percentile selector (p75, p90, p95, p99) to see whether a problem affects most mobile visitors or just the slowest tail.
Tip
p75 is the percentile Google uses to grade Core Web Vitals, so it's the best starting point. Bump up to p95 or p99 when you're hunting down the worst-case experiences on low-end mobile devices.
Drilling into the cause
Once a device class looks slow, use the breakdowns on the Performance tab to find where the problem is:
- By page — which routes have the worst values for the selected metric. A single heavy template often drags a whole device segment down.
- By country — a world choropleth plus a ranked list, so you can tell a device problem apart from a network/geography problem.
- TTFB phases — a waterfall splitting Time to First Byte into DNS, connection, server, and transfer time, which helps separate backend slowness from network distance.
- Worst-offending elements — the specific selectors most responsible for the selected metric on each route.
Combining the device filter with these breakdowns is usually enough to localize an issue, for example "INP is poor on mobile, specifically on the checkout route."
Getting notified
Zenovay's automated alerts cover anomaly detection and traffic-spike notifications rather than per-metric, per-device thresholds. To get told when overall performance shifts, and to schedule recurring summaries, see the Performance Alerts guide.
Optimization strategies
Mobile-first
Because mobile is usually both the largest segment and the slowest, prioritize it:
- Reduce JavaScript — typically the biggest win for INP and load time
- Optimize and right-size images for mobile viewports
- Minimize layout shifts (CLS)
- Improve tap-target sizes
- Test on real low-end devices, not just an emulator
Serve the right assets per device
Use responsive images so phones don't download desktop-sized files:
<!-- Responsive images -->
<picture>
  <source
    srcset="image-mobile.webp"
    media="(max-width: 768px)"
  >
  <source
    srcset="image-desktop.webp"
    media="(min-width: 769px)"
  >
  <img src="image-fallback.jpg" alt="Description">
</picture>
Progressive enhancement
Feature-detect rather than assuming every device supports every API:
// Feature detection
if ('IntersectionObserver' in window) {
  // Use modern lazy loading
} else {
  // Fall back to a simpler approach
}
Performance budgets by device
A simple way to keep regressions out is to set a budget per device class and treat anything over it as a bug:
Performance Budgets

Metric      Desktop    Mobile
LCP         < 2.0s     < 2.5s
INP         < 150ms    < 200ms
CLS         < 0.05     < 0.1
Troubleshooting
No device data
Check:
- The tracking script is installed on the pages you expect (see Install the tracking script)
- Visitors aren't all being blocked by privacy tools or ad blockers
- There's enough recent traffic to fill the selected time range
A device class shows no metrics
Core Web Vitals are collected from real visits. A brand-new site, a low-traffic page, or a very short time range may not have enough samples for a device split yet — widen the range or wait for more traffic.