The Performance tab shows how fast your pages load for real visitors. It collects timing data from the same tracking script you already installed, so there's nothing extra to set up, and the numbers reflect what people actually experienced rather than a synthetic lab run.
Opening the Performance tab
Open your website's dashboard from Domains, then select the Performance tab in the sidebar (under the Behavior group). The direct URL is app.zenovay.com/domains/{your-site}?tab=performance.
At the top of the tab you'll find three controls that apply to everything below them:
- Percentile (p75, p90, p95, p99): which slice of your visitors a value describes. p75 is the standard for Core Web Vitals, p95 and p99 surface your slowest tail.
- Device: filter to all devices, desktop, or mobile.
- Time range: 24h, 7d, 30d, or 90d.
What's measured
Zenovay captures field timing data (Real User Monitoring) for each page view:
| Metric | What it measures | "Good" threshold |
|---|---|---|
| LCP | Largest Contentful Paint, when the main content renders | < 2.5s |
| INP | Interaction to Next Paint, responsiveness to input | < 200ms |
| CLS | Cumulative Layout Shift, visual stability | < 0.1 |
| FCP | First Contentful Paint, when the first content appears | < 1.8s |
| TTFB | Time to First Byte, server response time | < 800ms |
LCP, INP, and CLS are the three Core Web Vitals. FCP and TTFB are secondary diagnostics that help explain a poor LCP.
Info
Performance metrics are sampled from real visits, so you need a reasonable amount of traffic before the numbers stabilize. A brand new site, or one with very low traffic, may show a "collecting data" state until enough samples come in.
Reading the dashboard
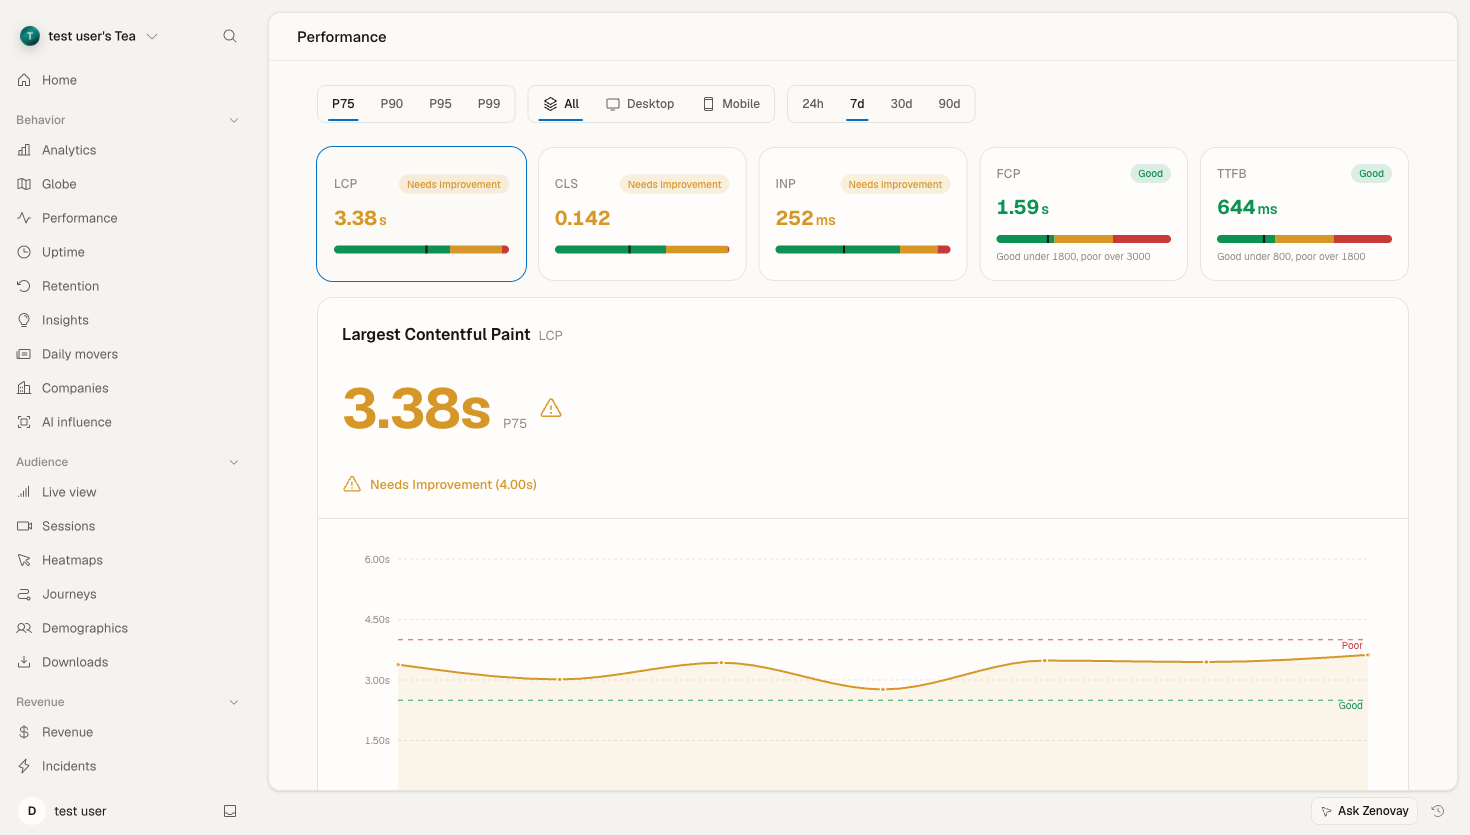
Metric tiles and the hero chart
Across the top, a tile for each metric shows its value at the selected percentile with a good / needs-improvement / poor band. Select a tile to make it the active metric: the hero panel below charts that metric's trend over the selected time range, so you can see whether it's improving or regressing.
Breakdown by route
The routes breakdown lists your pages with their metric values, so you can spot which specific pages are slow. Sort or scan to find the worst offenders, then dig into the one that matters most for your business (a checkout or signup page weighs more than an obscure archive page).
Breakdown by country and the map
The countries breakdown and the geographic map show the same metric split by visitor location. This is the quickest way to tell whether a slow score is a real backend problem or just distance: if North America is fast but Asia Pacific is slow, a CDN or edge caching is usually the fix.
TTFB phases
When the data is available, the TTFB waterfall decomposes Time to First Byte into its network phases (DNS, connect, server, transfer) so you can see where the server-response time is going. This phase breakdown is collected going forward, so newer data fills in over time. Until phase data is present for a page, the panel shows a "collecting" state rather than a partial bar.
Offending elements
For each route, Zenovay can surface the element responsible for a poor metric, for example the specific image that triggered the Largest Contentful Paint or the element behind a layout shift. Like the TTFB phases, element attribution is collected going forward, so it appears once enough new samples have been gathered.
Working out what to fix
A practical loop:
- Set the percentile to p75 to match the Core Web Vitals standard (use p95 / p99 to investigate your slow tail).
- Pick the metric that's failing in the tiles.
- Open the routes breakdown to find which pages are responsible.
- Check the countries breakdown to rule out geography.
- If TTFB is high, the problem is usually server-side (slow queries, no caching, or distance, which a CDN fixes). If LCP is high but TTFB is fine, the problem is usually on the page itself (large images, render-blocking CSS/JS).
For a deeper explanation of each metric and how to improve it, see Core Web Vitals.
Comparing across devices
Mobile and desktop almost always tell different stories, because phones have slower CPUs and more variable networks. Use the Device filter to look at each segment on its own, or read Performance by Device for a focused walkthrough.
Getting notified about regressions
Rather than checking the tab manually, you can set up alerts that notify you when a metric crosses a threshold. See Performance Alerts to configure them.
Troubleshooting
No data, or "collecting data"
Check that:
- The tracking script is installed and loading on the pages you expect (verify in your browser's network tab).
- The site has enough traffic. Performance metrics need real visits to populate.
- An ad blocker or content blocker isn't preventing the script from running for some visitors.
Numbers look different from a Lighthouse run
This is expected. Zenovay reports field data from your real visitors across many devices and networks. Lighthouse reports a single lab run on one simulated device. They measure different things and rarely match exactly. Field data is what reflects your actual users' experience.
High variance
Some spread is normal, especially on mobile traffic, a globally distributed audience, or during peak-traffic periods. Use percentiles (p75 / p95) instead of an average to read the distribution honestly.