Automatically capture JavaScript errors across your website with detailed context for faster debugging.
Enabling Error Tracking
Error tracking captures uncaught JavaScript errors and unhandled promise rejections automatically once it's turned on for a website. It's part of the same tracking script you already installed:
<script
  defer
  data-tracking-code="YOUR_TRACKING_CODE"
  src="https://api.zenovay.com/z.js"
></script>
Turn It On
Error tracking is controlled by a feature flag on each website:
- Open your website's dashboard and go to Settings → Advanced
- Under Feature Flags, toggle Error Tracking on
That's it. There's no script change to make, the flag is delivered to the tracker automatically. New errors then start showing up in the Errors tab.
Info
Error tracking is a Pro feature. If the toggle shows a required-plan pill, you'll need to be on Pro, Scale, or Enterprise to enable it.
What's Captured
Error Information
For each error, Zenovay captures:
| Data | Description |
|---|---|
| Error message | The error description |
| Error type | TypeError, ReferenceError, etc. |
| Stack trace | Full call stack |
| Source file | File where error occurred |
| Line & column | Exact position |
| URL | Page where error happened |
| User agent | Browser and OS |
| Visitor ID | Link to session |
| Timestamp | When error occurred |
Context Data
Additional context captured with each error:
- Page URL and referrer
- Browser and device information
- Breadcrumbs: recent navigation, clicks, console output, and network requests leading up to the error
- The release and environment the error was reported under (if your code sets them)
Viewing Errors
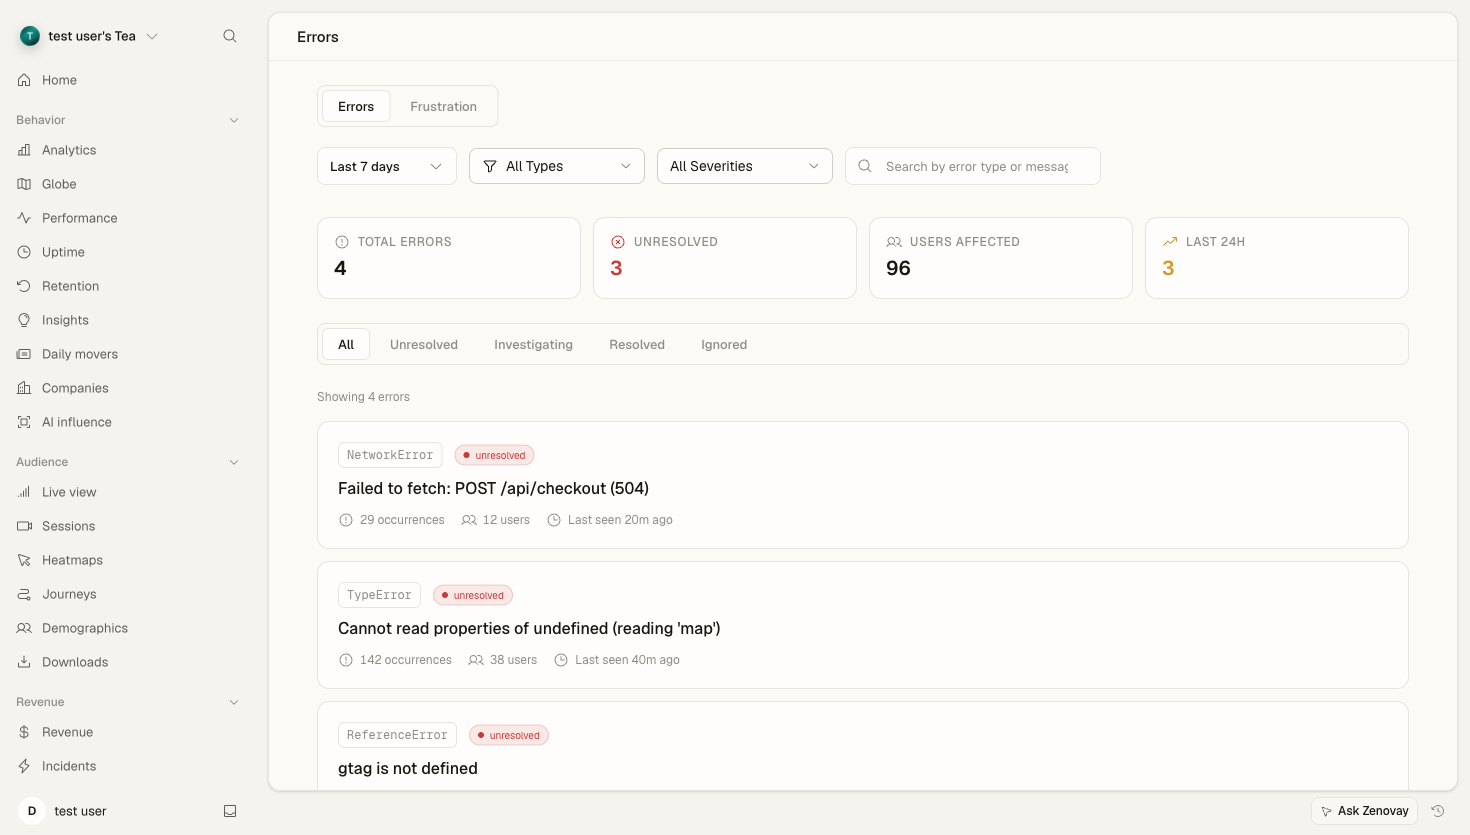
Errors Dashboard
Open your website's dashboard and select the Errors tab (under Reliability in the sidebar):
- See error count trends over time
- View top error groups by occurrence
- Filter by status
- Click any error group for details
Error List
The error list shows:
| Column | Description |
|---|---|
| Error | Error message (truncated) |
| Count | Number of occurrences |
| First Seen | When first occurred |
| Last Seen | Most recent occurrence |
| Status | Unresolved, Investigating, Resolved, or Ignored |
Error Detail View
Click an error group to see:
- Full error message
- Stack trace
- Affected browsers, operating systems, and devices
- Pages where the error occurs
- Timeline of occurrences
- Breadcrumbs leading up to the error
You can also change a group's status (mark it as Investigating, Resolved, or Ignored) to keep your list focused on what still needs attention.
Error Types
Common Error Types
| Type | Description | Common Causes |
|---|---|---|
TypeError | Type-related error | Accessing undefined properties |
ReferenceError | Reference to undefined | Undefined variables |
SyntaxError | Invalid syntax | Malformed JSON, typos |
RangeError | Value out of range | Invalid array length |
URIError | URI handling error | Malformed URIs |
EvalError | eval() error | Deprecated, rarely seen |
Errors are also classified by category (JavaScript, network, resource, or custom) and severity, which the dashboard uses to help you prioritise.
Promise Rejections
// Unhandled rejection - captured automatically
Promise.reject(new Error('Something failed'));

// Handled rejection - not captured
Promise.reject(new Error('Something failed'))
  .catch(error => handleError(error));
Source Maps
Minified code produces unreadable stack traces:
Error: undefined is not a function
    at a.b (main.min.js:1:2345)
    at c.d (main.min.js:1:3456)
With source maps uploaded, the dashboard can show your original code instead:
Error: undefined is not a function
    at processPayment (checkout.js:45:12)
    at handleSubmit (form.js:123:8)
Source maps are uploaded through the error-tracking API and matched to errors by a release identifier. Wire the upload into your build pipeline so every release ships with its maps.
For the full upload reference (endpoint, fields, and a CI example), see Source maps for JS errors.
Filtering Errors
Errors that originate from Zenovay's own tracking infrastructure are dropped automatically, so you only see errors from your own code.
To cut remaining noise, focus on what's actionable in the dashboard:
- Use the Ignored status to silence a known third-party or browser-extension error so it stops cluttering your list.
- Resolve groups you've fixed so new occurrences stand out.
Error Alerts
Get notified when errors spike using an automation rule:
- Open your website's dashboard and go to Settings → Automation
- Create a rule with the Error rate threshold trigger
- Set the threshold (errors per hour)
- Choose how you want to be notified: email, webhook, or Slack
When the error rate crosses your threshold, Zenovay fires the action you configured.
Integration with Session Replay
If session replay is enabled for the website, errors can be linked to recordings so you can see what the user was doing when an error occurred. Session replay has an Errors only trigger mode (under Settings → Advanced → Feature Flags) that records sessions specifically around errors, which keeps storage focused on the sessions worth watching.
This helps you understand:
- What the user was doing
- UI state when the error occurred
- Steps to reproduce
Best Practices
Handle Errors Deliberately
Catch and handle errors you can recover from, and let the ones you can't surface to the tracker:
// Good: specific, recoverable handling
try {
  const data = JSON.parse(userInput);
} catch (error) {
  if (error instanceof SyntaxError) {
    showValidationError('Invalid JSON format');
  } else {
    throw error; // unrecoverable - let it be captured
  }
}
Noise Reduction
- Mark browser-extension and known third-party errors as Ignored
- Resolve groups as you ship fixes
- Prioritise by severity and occurrence count
Troubleshooting
Errors Not Appearing
Check:
- The script loads before errors occur
- Error tracking is enabled under Settings → Advanced → Feature Flags
- An ad blocker isn't blocking requests to
api.zenovay.com
Missing Stack Traces
Verify:
- Source maps are uploaded for minified code (see Source maps for JS errors)
- CORS headers are set for cross-origin scripts
- The error isn't coming from a third-party script
Too Many Errors
Consider:
- Marking known-noisy groups as Ignored
- Reviewing and fixing high-volume errors first