Open any identified company to see how it has engaged with your site: visits over time, the pages it views most, where its visitors are based, and its recent activity. Company identification is part of the Scale plan.
Opening a company
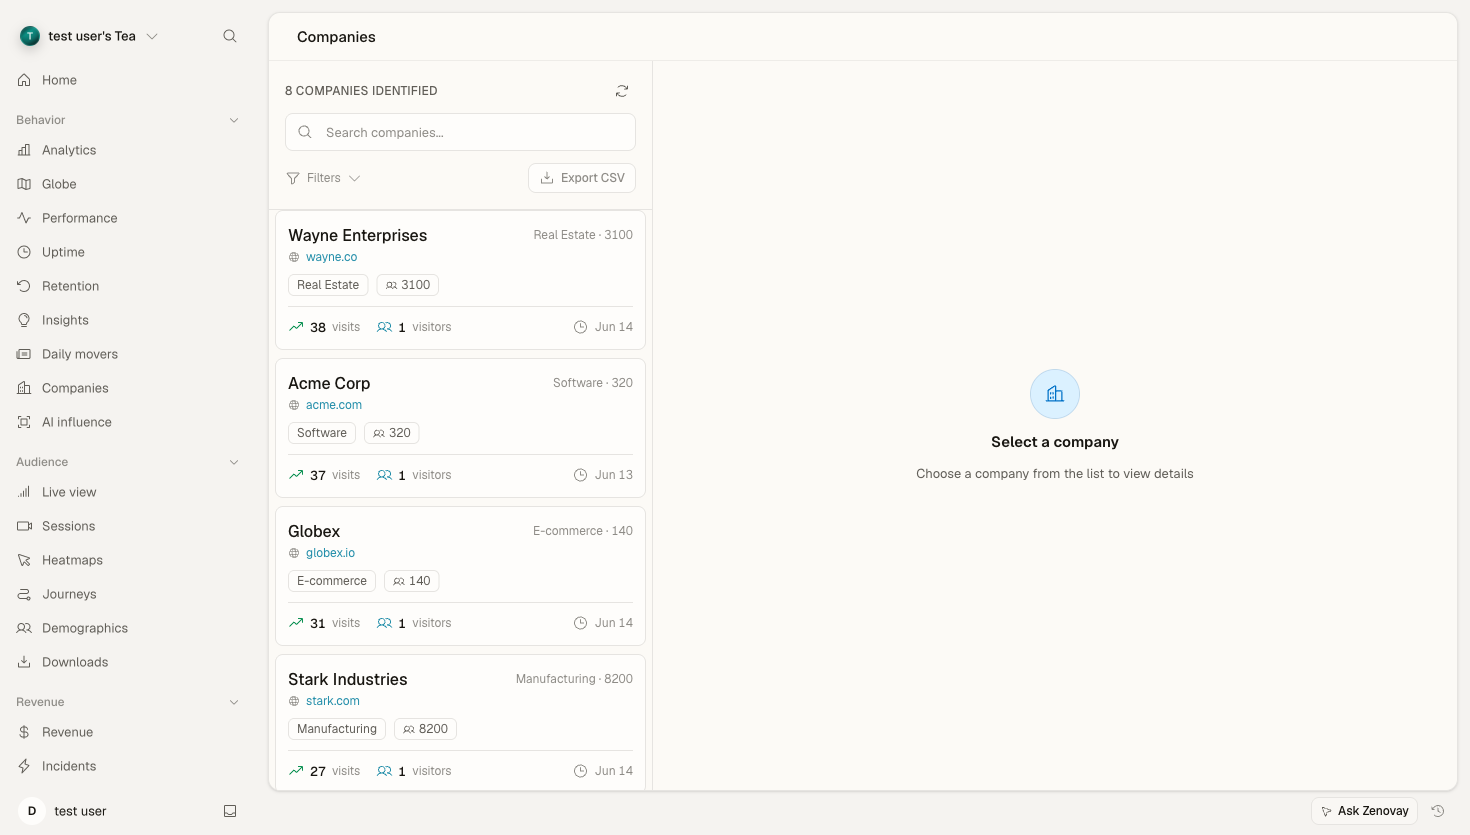
- Open your website's dashboard and select the Companies tab (in the Behavior group of the sidebar).
- Use the search box to filter by company name or domain, or scroll the list.
- Click a company to open its detail view alongside the list.
Info
Companies are identified from visitor IP addresses. Coverage is best for businesses on their own corporate networks, and lower for remote workers, mobile networks, and ISP-assigned addresses. See B2B company identification for how matching works.
The company detail view
The header shows the company name, website (when known), and headquarters location, along with any firmographic data Zenovay was able to enrich:
| Field | Notes |
|---|---|
| Industry | When available from enrichment |
| Company size | Employee-count range, when available |
| Revenue range | When available from enrichment |
Engagement stats
Four headline metrics summarise the relationship:
| Metric | Description |
|---|---|
| Total Visits | All visits attributed to this company |
| Unique Visitors | Distinct visitors seen (estimated) |
| Page Views | Total pageviews across those visits |
| Last Seen | How long ago the most recent visit was |
Visit activity
A chart plots visits over time. Use the period buttons to switch the window between 30d, 90d, 6m, 1y, and All. Longer windows depend on your plan's data retention; locked options show an upgrade prompt.
Visitor locations
A breakdown of which countries this company's visitors came from, with visit counts per country.
Top pages
The pages this company has viewed most often. When a company domain is known, each page is shown with the company's favicon.
Device breakdown
The split of this company's visits across desktop, mobile, and tablet.
Recent activity
A reverse-chronological list of recent visits. Each entry shows when the visit happened, how many pages were viewed, and a sample of the pages from that visit.
Company insights
A small footer block with the enrichment source, when the company was first seen, and when it was last seen.
Exporting companies
You can export the full company list as a CSV from the Companies tab:
- Open the Companies tab.
- Click Export.
- A CSV downloads with one row per company.
What's in the export
The CSV includes, per company: name, domain, industry, employee count, revenue range, visits, unique visitors, page views, average session duration, source, first seen, last seen, city, and country.
Info
The export covers the company list. There is no per-company PDF or JSON export, and Zenovay does not push company activity into a CRM. Use the CSV to feed your own outreach or CRM workflows.
Reading the signals
Visit history is most useful for spotting buying intent. Watch for:
- A jump in visit frequency after a quiet period
- Several distinct visitors from the same company
- Repeated views of pricing, product, or documentation pages
- A company returning after first discovering you
Use what you see for context when you reach out: reference the pages they spent time on and time your outreach to recent activity.
Troubleshooting
A company's visits look incomplete
- Check the period selector on the visit-activity chart, you may be looking at a short window.
- Allow time for processing, identification and enrichment are not instant.
- Some visitors can't be matched to a company (remote workers, mobile networks, VPNs, ad blockers), so a company's real footprint may be larger than what's shown.
A match looks wrong
- The IP may belong to an ISP or shared network rather than the company itself.
- Large organisations can appear under more than one entity.
See B2B company identification for the full picture on accuracy and confidence.